🔭 Visualize a Network
mujou.viz.to_html draws the graph of a network as a page of HTML. The page starts at the top of the network: click a network to open it, and a node to see its ports. This page shows how to write the page and how to read it.
What you will learn
- How to write the page of a network, without running it
- What the boxes, rows and arrows of the page mean
- How to open the networks inside, and see the specs of a node's ports
You should know Ports and Channels and the paths of a network.
Write the page
In short
mujou.viz.to_html(net) returns the page as a string. Save it and open it in a browser.
class Plant(mujou.Network):
    def __init__(self) -> None:
        super().__init__()
        self.left = Filter()  # a network in a network
        self.right = Filter()
        self.monitor = Monitor()
        self.left.next.connect(self.monitor.prev)
        self.right.next.connect(self.monitor.prev)


net = Plant()
Path("graph.html").write_text(mujou.viz.to_html(net), "utf-8")  # open it in a browser
to_html reads the network as mujou.run does, but runs nothing: no hook is called and no thread starts. So it shows the nodes by the same paths as a run, and a network that mujou.run refuses (a port connected to a node outside the network, say) raises the same error here.
The page is one file with nothing to download, so it opens offline, and you can send it to someone as it is. mujou.viz is not imported by import mujou: import it by name.
Try it
In short
Below is the very page that the program above writes. Click the boxes to open them, and select a node.
Read the page
In short
A network is a box with a + until you open it. A node is a white box with a row per port. An arrow is a channel, pointing to the end that receives.
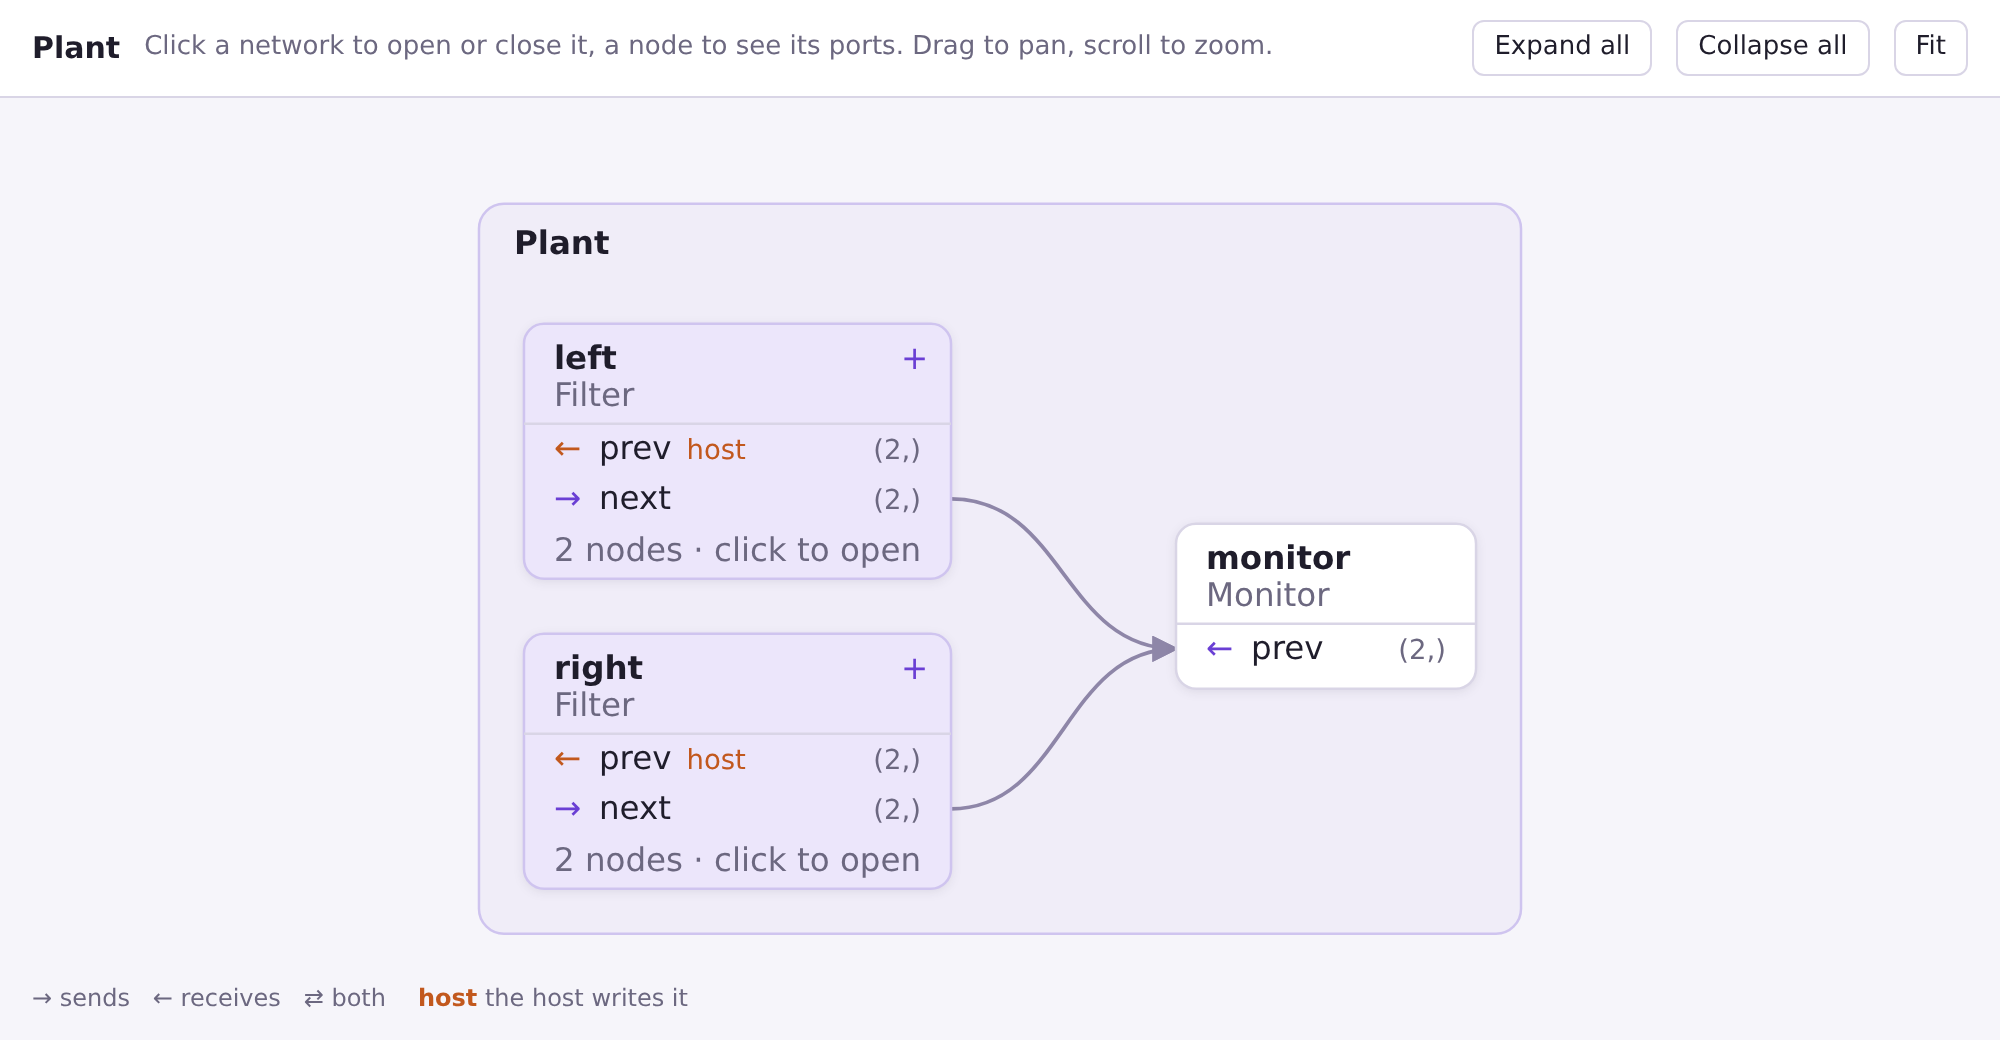
| On the page | What it is |
|---|---|
The outer frame (Plant) |
The root you passed to to_html |
A box with + (left, right) |
A closed network. Its rows are the ports it exposes (self.prev = self.fast.prev) |
A white box (monitor) |
A node, its attribute name in bold and its class below |
| A row | A port. The mark is what it does: → sends, ← receives, ⇄ both |
| The text at the right of a row | The shape of its spec: (2,). in … · out … when what it receives differs |
host |
An unconnected Port that receives: the host writes it with Run.write |
| An arrow | A channel. The head is at the end that receives; a channel that goes both ways has two |
×3 on an arrow |
Three channels between the same two rows, drawn as one |
Open a network
In short
Click a closed network to open it, and its header to close it again. A channel to a node inside a closed network goes to the network's box.
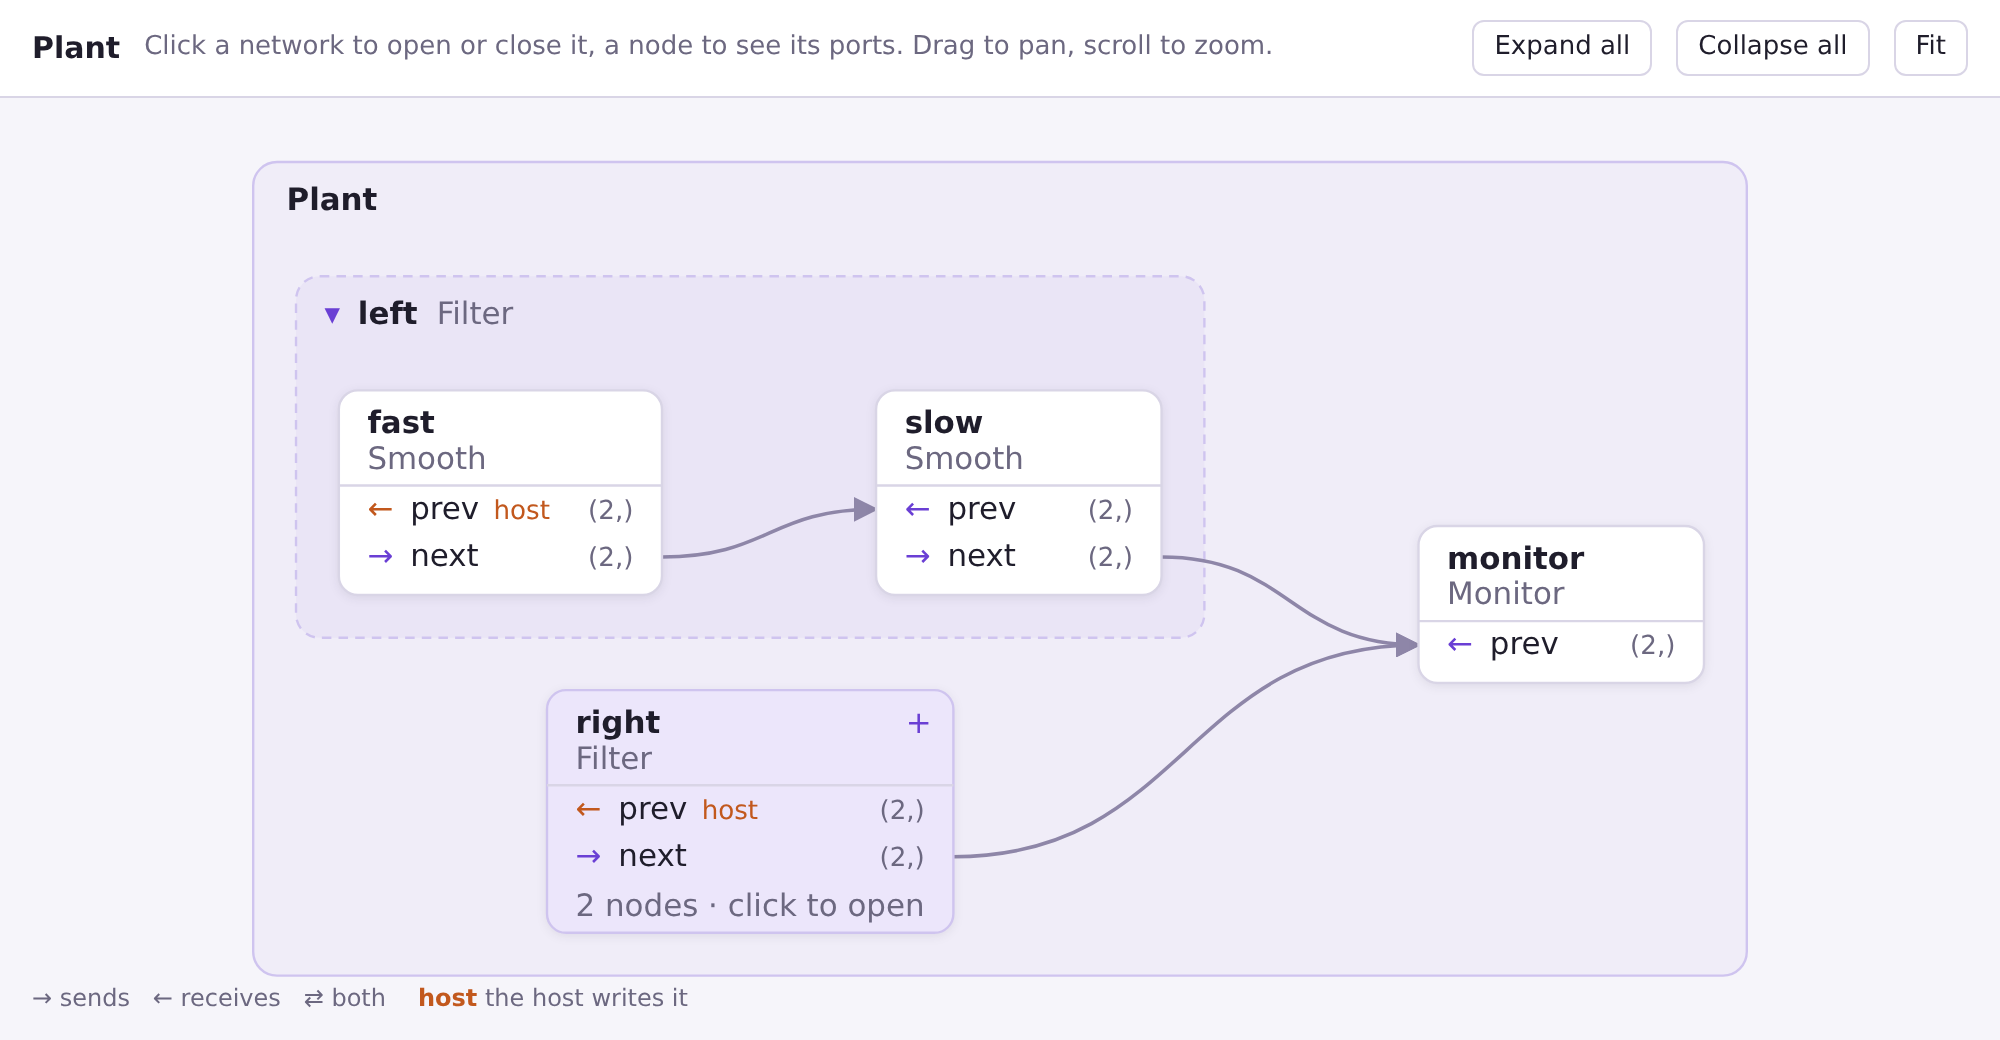
Opening left shows its two nodes, fast and slow, in a dashed frame. The channel from left to monitor now starts at slow.next, the port that left.next refers to. right is still closed, so its channel still starts at the box of right.
Each network is laid out on its own: its children go from left to right in the order of their channels (a node that sends comes before the node that receives), and children in the same column keep the order of assignment.
See a node
In short
Click a node to see its path, period and device, and the full spec and peers of each port.
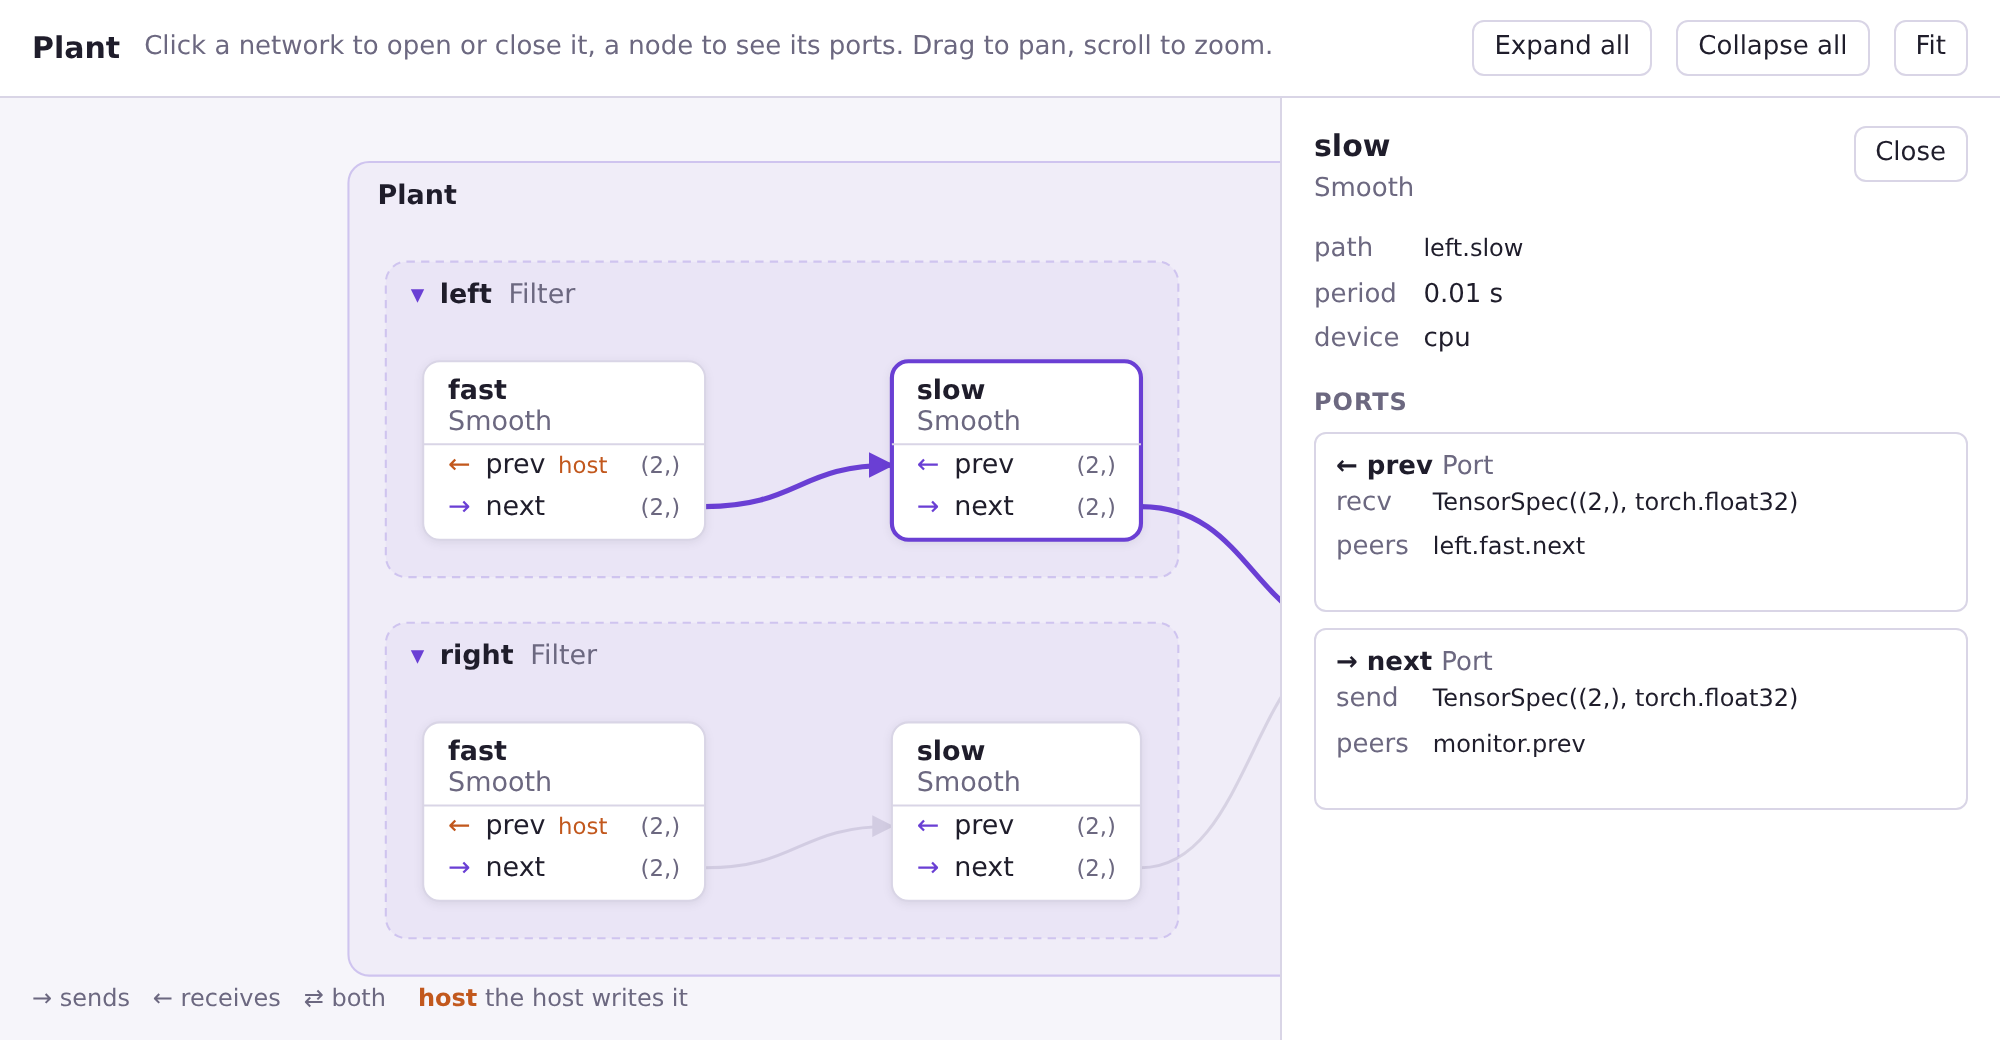
Hovering over a box highlights its channels. The panel shows what the box leaves out:
| In the panel | What it is |
|---|---|
| path | The path of the node in the run (left.slow), as in Run.state_dict() |
| period | Node(period=...), in seconds of the run's timer |
| device | Node(device=...) |
| send, recv | The full specs of the port, dtype included |
| peers | The ports at the other ends of its channels, or "the host writes it" |
Move around
| To | Do |
|---|---|
| Open or close every network | Expand all / Collapse all |
| Show the whole graph | Fit |
| Move the view | Drag the background |
| Zoom | Scroll |
The page follows the light or dark theme of the browser.
A pc.Chain
to_html draws any network, the networks of mujou.pc included:
B = 8
chain = pc.Chain(
    nn.Sequential(nn.Linear(784, 256), nn.ReLU()),
    nn.Linear(256, 10),
    x=TensorSpec((B, 784)),
    y=TensorSpec((B,), torch.int64),
    batch=B,
    loss=pc.loss.CrossEntropyLoss(B),
    tau=pc.TimeConstants(h=4e-3, lam=2e-3, r=4e-3),
    optimizer=pc.optim.SGD(tau=1.28),
    learn_interval=0.15,
)
Path("chain.html").write_text(mujou.viz.to_html(chain), "utf-8")
A pc.Chain shows input, layer0, ..., output in a row, each connected to the next by a channel that goes both ways: the activity goes forward and the feedback comes back. The page it writes.
Why HTML, and not an image?
A network of many nodes does not fit in one image that you can read. The page shows only the top of the network at first, and you open what you want to see. It needs nothing but a browser, and no package beyond Mujou.